


Social change infographics
Project
Design-Driven Social Change Infographics
Challenge
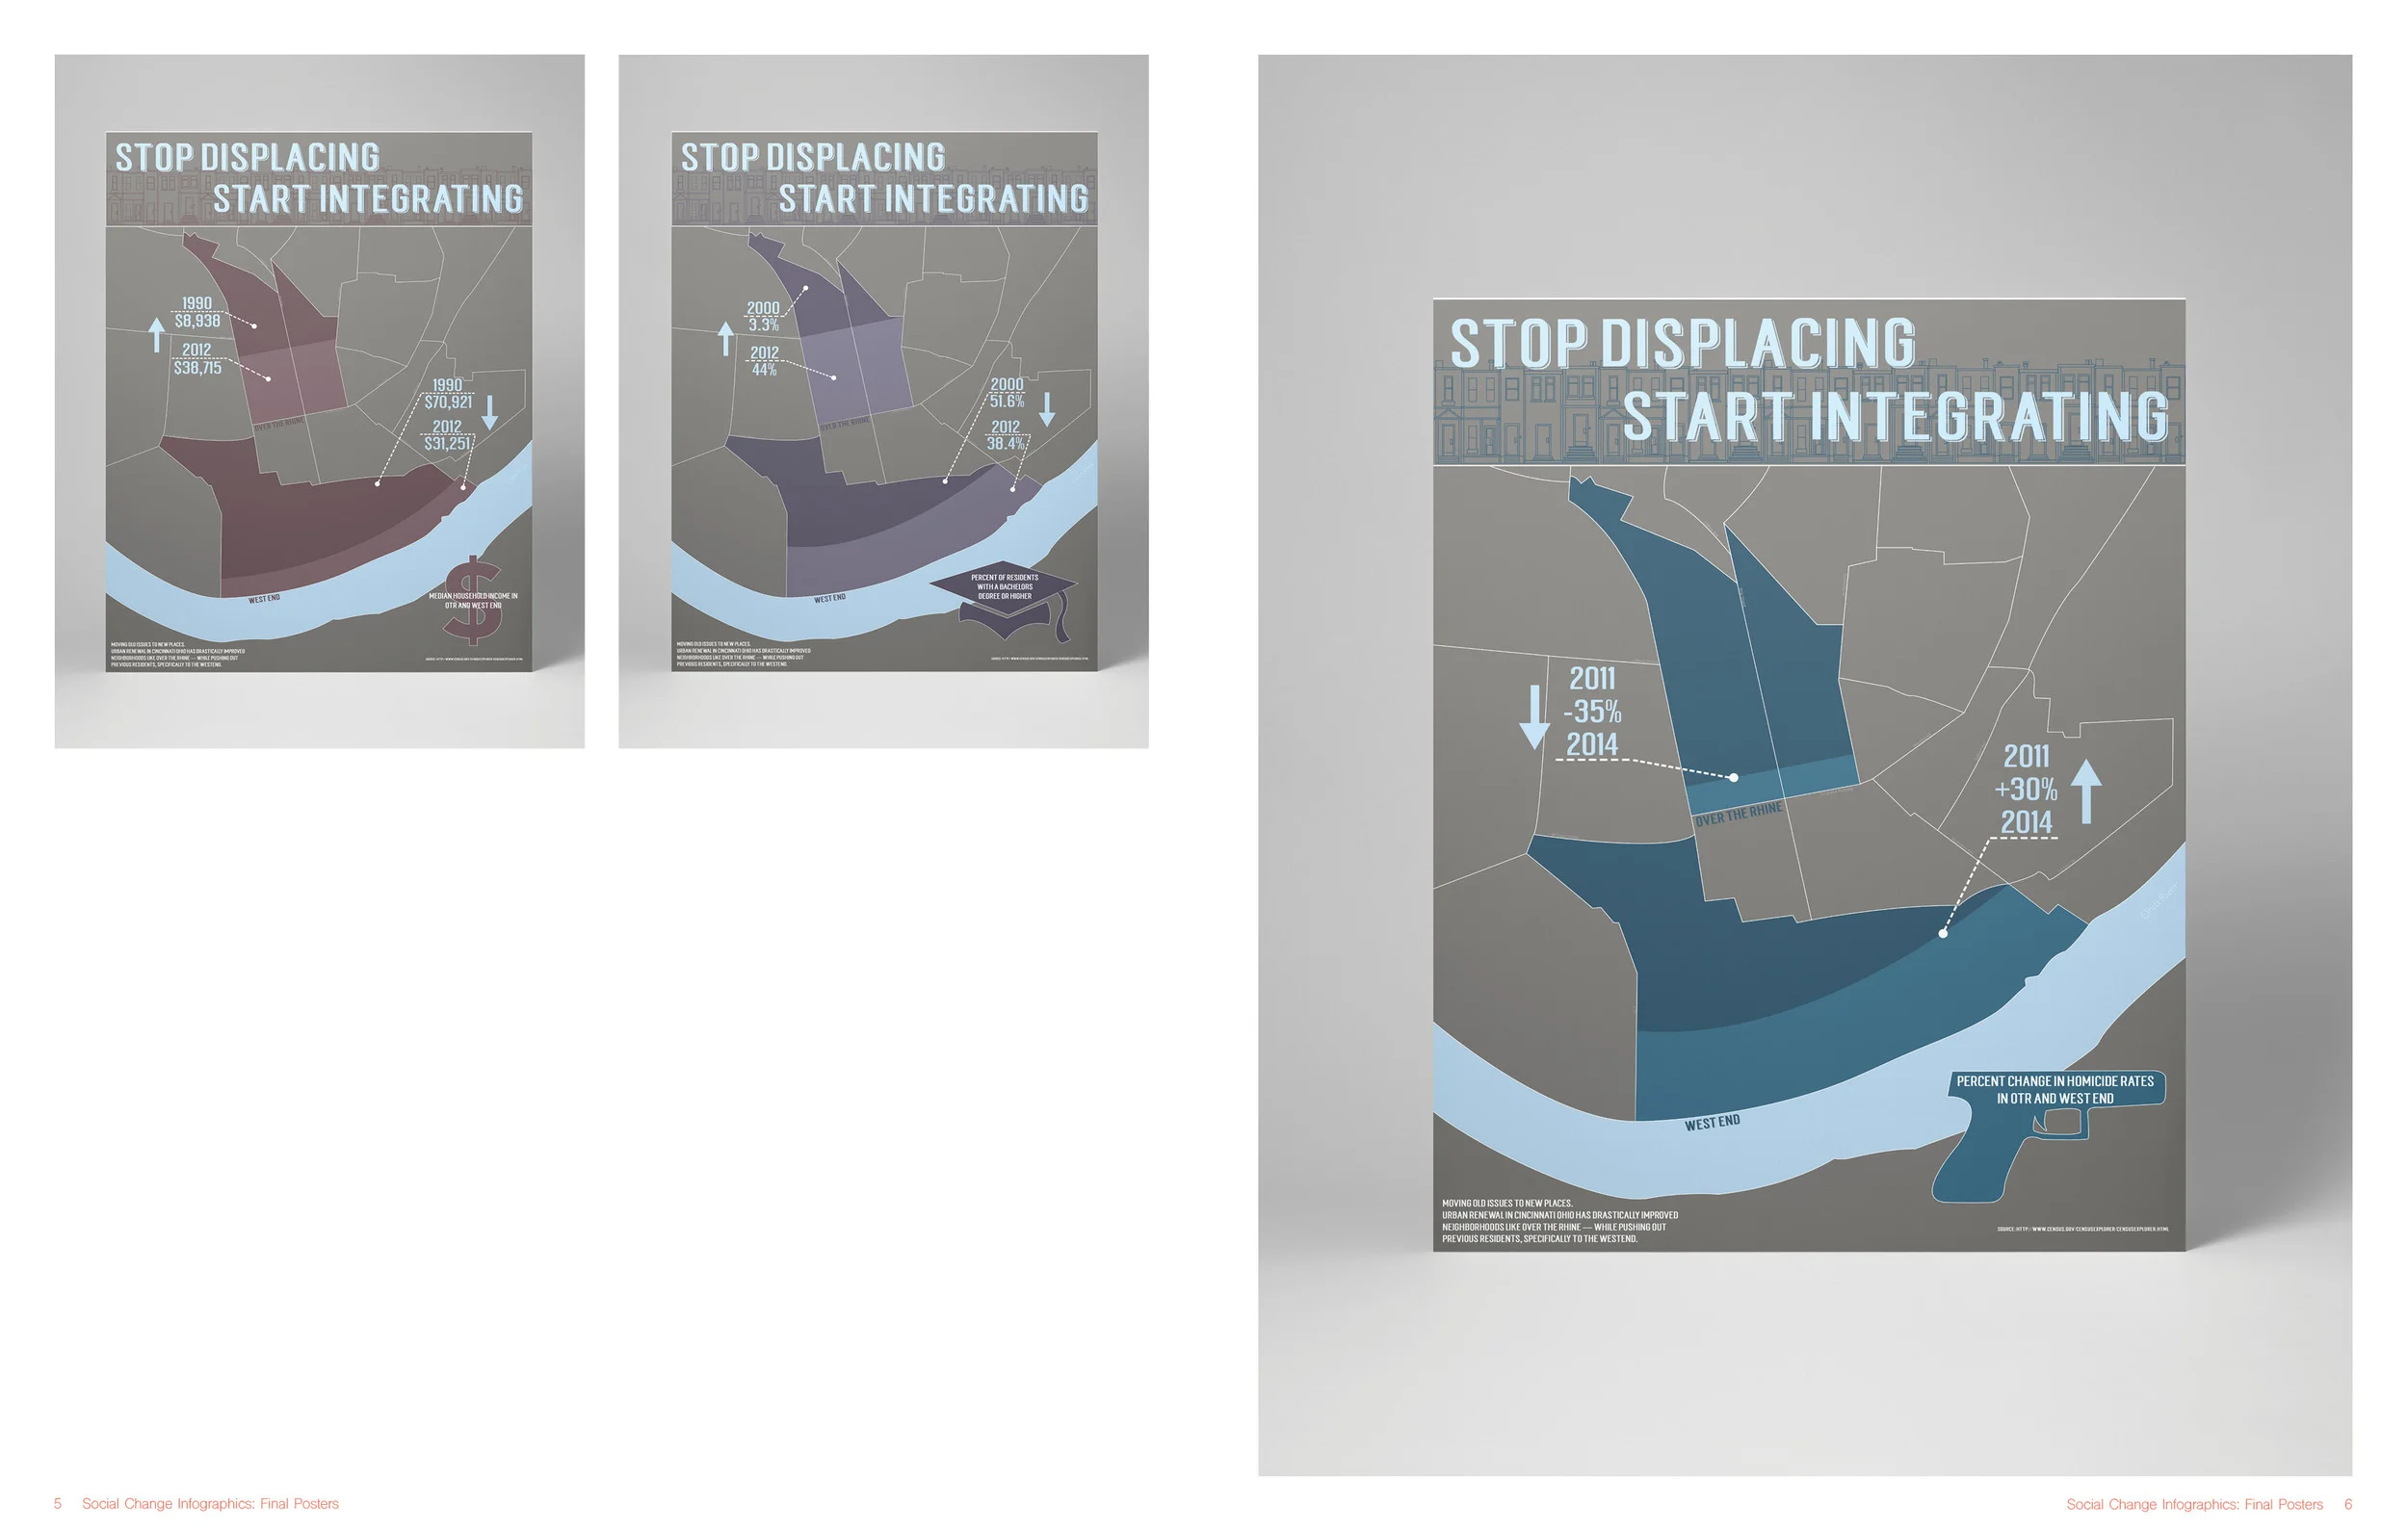
Design a campaign to build awareness of a selected societal issue sponsored by the Miami University Philanthropic Association. Develop a series of three posters. In each poster, use an infographic to draw the reader’s interest and then present the call to action information as secondary content. All three final infographics should be related. Write the copy to make sense with your infographic and statistics and establish a clear hierarchy for the information in your poster. Create unique imagery that expresses the concept and tone consistently through all elements of the campaign.
Solution
I chose to create a set of infographics displaying the shift in population between two neighborhoods in Cincinnati Ohio, Over the Rhine and West End. Using data from the United States Census Bureau I correlated median household income, bachelor degrees, and homicide rates to movement of the population from Over the Rhine to West End.